|
Can NASDAQ avoid strike three? So much for progress; four months into 2002 the Dow Jones industrial average, the Nasdaq composite index, and the Standard & Poors 500 index are all lower, following two straight annual
declines.
But will this year’s market resemble 1982, when stocks began a string of nearly 19 consecutive annual gains? Or will it look more like 1975, when the market, following two years of losses, rose and fell in fits and starts until 1982.
In fact, nobody knows. If you question the specialists, the financial analysts, the banks, even Alan Greenspan -the king, or should I say the savior of the US economy-, they are all in a big blur. Six months ago, they said that by today the stock market would show some gains. But look at where we are! Today, according to the specialists, we should be buying because the market is so low that there is nothing left but opportunity! Well, let's see with our own eyes what the NASDAQ composite is saying. Let's look deeper than just numbers.
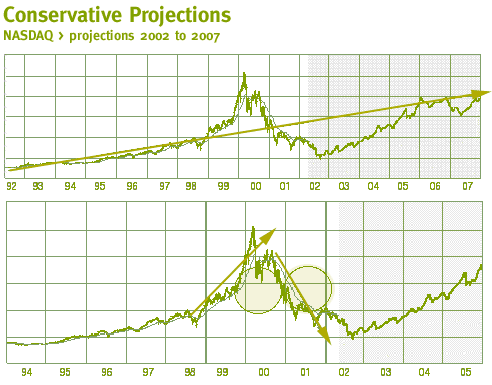
This is where the analysts are wrong. They should focus on one thing: the slope of the NASDAQ. This slope is talking to us. By comparing the graphs from 15 years ago with present-day graphs, we can see a pattern. Let's try to read the angles, let's try to decode this new language. When design meets finance... We can see the future.

|

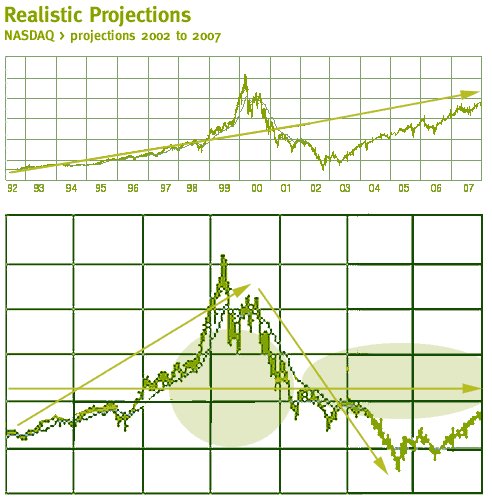
In 1998 the graph gradually increases with an average slope of 10 degrees. Then, from 1999 to the beginning of 2000, the graph gains momentum with an average slope of 68 degrees. This shows the speculative bubble created by the technology sector. In order for this graph to undergo a logical correction, the same 68-degree slope should be reflected on the down-side. As you can see, the negative slope is only around 60 degrees, and will take more time to correct. Only once this is done can we speculate on the future. The slope has to reach the same angle, it's just a matter of time. |
 |

Here is what we envision at jlvdesign.com: Around September we think the NASDAQ index will be lower than expected. It will reach the low ofthis recession around 1,450 points, and we even speculate that a low of around 1,280 points is possible.
After, and only after this projected low, the NASDAQ will then be able to show uninterrupted gains for 5 years. Only in 2007 will the NASDAQ reenter positive territory (compared to the gains of 2000 of course)
Let's wait and see... |

|